For construction companies, understanding and tracking key performance metrics is vital to maintaining financial health and driving business success. These metrics, ranging from financial indicators to project performance and customer satisfaction, offer critical insights into how well a company is performing and where improvements can be made.
In this article, we go over the most important KPI’s for builders
- Gross Profit Margin
- Net Profit Margin
- Revenue
- Liquidity (Cash Flow)
- Schedule Compliance
- Cost Performance
- Monthly Lead Flow
- Cost Per Lead (CPL)
- Close Rate
- Return on Marketing (ROM)
- Customer Satisfaction (NPS, CES, CSAT)
By consistently focusing on these essential metrics, construction companies can make informed decisions that enhance operations, profitability, and sustainability over time.
Financial KPI’s
Financial metrics are crucial indicators of a construction company’s overall health and performance. Key financial metrics include:

Gross Profit Margin
One of the key metrics is gross profit margin, which measures the revenue generated from projects minus the cost of sales, expressed as a percentage of total revenue.
For custom home builders, a typical benchmark is a 25% gross profit margin, reflecting a healthy balance between project costs and revenue.
This margin helps construction companies gauge whether their pricing and cost management strategies are effective.

Net Profit Margin
The net profit margin represents the percentage of total revenue that remains as profit after deducting all project-related costs and fixed expenses, such as labor, materials, overhead, and administrative costs. This metric is a key indicator of a construction company’s overall profitability and financial efficiency.
For custom home builders, the industry benchmark for a healthy net profit margin is typically around 10%. Achieving this level of profitability means that for every dollar earned, the company retains 10 cents as profit after covering all operational expenses.
Monitoring the net profit margin helps construction businesses evaluate whether their pricing, cost management, and operational strategies are effective in maximizing profitability and ensuring long-term financial sustainability.
Revenue
Revenue is one of the most fundamental financial metrics for construction companies, representing the total income generated from all projects over a specific period.
Builders should closely monitor their quarterly revenue and compare it against key benchmarks, such as their budget, the previous quarter’s revenue, and revenue from the same period in the previous year.
This comparison provides valuable insights into performance trends, allowing businesses to identify growth opportunities or potential issues that need addressing.
Liquidity (Cash Flow)
Liquidity refers to a company’s ability to meet its short-term financial obligations, such as paying suppliers, employees, and other immediate expenses.
In the construction industry, where cash flow can fluctuate based on project schedules and payments, maintaining strong liquidity is essential for smooth operations.
Banks and financial institutions pay close attention to a construction company’s liquidity when evaluating loan applications or creditworthiness.
Sufficient liquidity indicates that a business has the necessary cash or easily convertible assets to cover its short-term debts, reducing the risk of financial strain.
A healthy liquidity position not only helps a construction company manage day-to-day expenses but also improves its chances of securing financing and maintaining a solid reputation with partners and stakeholders.
Project Performance Metrics
Schedule Compliance
Schedule compliance measures how well a construction company adheres to the planned project timeline, reflecting the efficiency of its scheduling process.
Maintaining schedule compliance is critical in the construction industry, where delays can lead to increased costs, dissatisfied clients, and a negative impact on future business opportunities.
By closely tracking how well a project stays on schedule, companies can identify potential bottlenecks, improve resource allocation, and ensure that labor, materials, and subcontractors are coordinated effectively.
Cost Performance
Tracking project costs against budgets is essential for maintaining profitability in the construction industry.
By regularly monitoring how actual expenses compare to the initial budget, construction companies can quickly identify any cost overruns or inefficiencies that may threaten the financial success of a project.
Staying within budget helps protect profit margins and ensures that the company does not lose money on unexpected expenses.
This process also allows businesses to make timely adjustments, whether by renegotiating with suppliers, reallocating resources, or revising timelines to prevent further cost escalations.
Marketing & Sales Metrics
Monthly Lead Flow
Monthly lead flow refers to the number of new inquiries or potential clients that a construction company receives each month. Consistently tracking monthly lead flow is crucial for understanding the effectiveness of marketing efforts and ensuring a steady pipeline of projects. By analyzing lead flow trends, builders can gauge whether their advertising, referrals, or other lead generation strategies are performing well and adjust their tactics accordingly.

Cost Per Lead
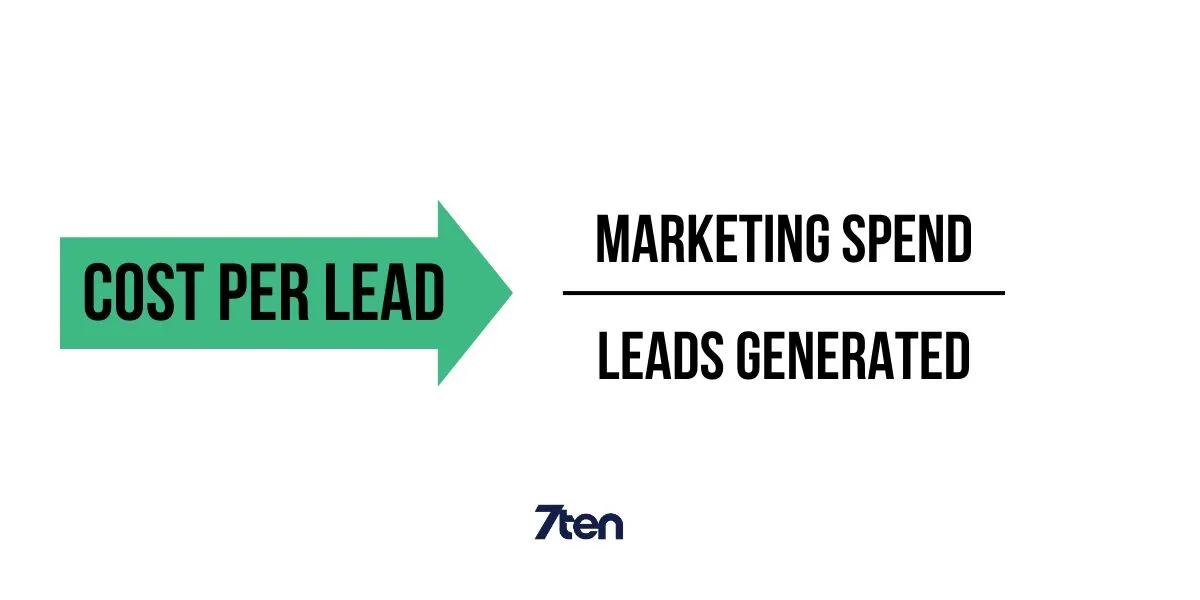
Cost per lead (CPL) is a key metric that measures how much a construction company spends to acquire a single lead or potential client through its marketing and advertising efforts. This metric helps businesses evaluate the efficiency of their marketing campaigns and determine whether their ad spend is delivering a good return on investment (ROI).
For example, if a company spends $1,500 on an ad campaign and generates 10 leads, the cost per lead would be $150. By tracking CPL, a construction company can assess the performance of different marketing channels (like Google Ads, social media, or referral programs) and focus more budget on the channels that produce the highest-quality leads at the lowest cost.

Close Rate
Close rate is a critical metric that measures the percentage of leads that convert into actual projects or sales. In the construction industry, it reflects how effectively a company can turn potential clients (leads) into signed contracts. For example, if a company receives 20 leads in a month and successfully converts 5 of them into projects, the close rate would be 25%.
A high close rate indicates that a company is skilled at selling its services, building client relationships, and meeting customer needs. Tracking this metric helps construction businesses identify how well their sales process is working and where improvements might be needed. If the close rate is low, it could point to issues with lead quality, sales follow-up, or pricing strategies.

Return On Marketing
Return on marketing (ROM) measures the effectiveness of a construction company’s marketing efforts by comparing the revenue generated from marketing campaigns to the amount spent on them. It’s a key metric that shows whether the company’s marketing investments are delivering a positive financial return. ROM is calculated by dividing the revenue generated from marketing by the total marketing costs and then multiplying by 100 to get a percentage.
For example, if a company spends $10,000 on a marketing campaign and it generates $50,000 in revenue, the return on marketing would be 500%. A positive ROM indicates that the marketing efforts are paying off, while a low or negative ROM suggests the need to re-evaluate the marketing strategy, targeting, or budget allocation.
Customer Satisfaction
Measuring customer satisfaction helps ensure long-term success. Key metrics include:
Net Promoter Score (NPS)
NPS measures how likely customers are to recommend your services to others.
It’s calculated by asking clients a simple question: “On a scale of 0 to 10, how likely are you to recommend our company to a friend or colleague?” Customers who respond with a 9 or 10 are considered “promoters,” those who respond with 7 or 8 are “passives,” and those who rate you below 6 are “detractors.”
NPS is then calculated by subtracting the percentage of detractors from the percentage of promoters. A high NPS indicates strong customer loyalty and satisfaction, while a low score suggests there may be issues that need to be addressed in the customer experience.
Customer Effort Score
CES measures how easy it was for customers to interact with your business or complete a specific task, such as requesting a quote, scheduling a project, or resolving an issue. The simpler and smoother the process, the higher the score.
This metric helps you understand whether customers find your processes convenient and easy to navigate. Reducing customer effort is key to improving satisfaction and increasing repeat business.
Construction companies can use CES to optimize communication, project timelines, and overall customer service.
Customer Satisfaction Score (CSAT)
CSAT directly measures how satisfied customers are with your services or a specific interaction, often through post-project surveys. Clients are asked to rate their satisfaction on a scale (e.g., from 1 to 5 or 1 to 10). High CSAT scores indicate that clients are pleased with the quality of your work and their overall experience. This score is useful for identifying areas of strength and improvement in your service delivery, such as project quality, responsiveness, or professionalism.
Takeaway
In 2025, construction companies should focus on tracking key performance indicators (KPIs) to maintain profitability and drive success. By consistently monitoring these metrics, companies can make informed decisions to enhance operations and ensure long-term growth.
If you’re looking to streamline your marketing efforts and optimize your lead generation, reach out to 7ten. We specialize in helping construction businesses like yours implement effective marketing strategies, track performance, and maximize ROI. Let us help you drive more leads and improve your bottom line.
Related Posts

Housecall Pro vs. Jobber: Which Is Right For You?
Learn More
Procore vs. Buildertrend: A Complete Comparison
Learn More
